Recent Posts
NetHack statistics
27. October, 2013
I've recently been playing NetHack on the nethack.alt.org server and was wondering how likely you are to ascend depending on how long you survive. If you don't know, NetHack is a notoriously difficult game, and few people ever beat it (or "ascend" as it's known.) However, the greatest difficulties occur in the early game, when not just mistakes will get you killed, but also the foibles of the Random Number Generator (or the Random Number God as s/he is sometimes called.) So with the help of nethack.alt.org's extended log, documenting over 2.3 million plays of the game, ipython and matplotlib, I cooked up the following graph:
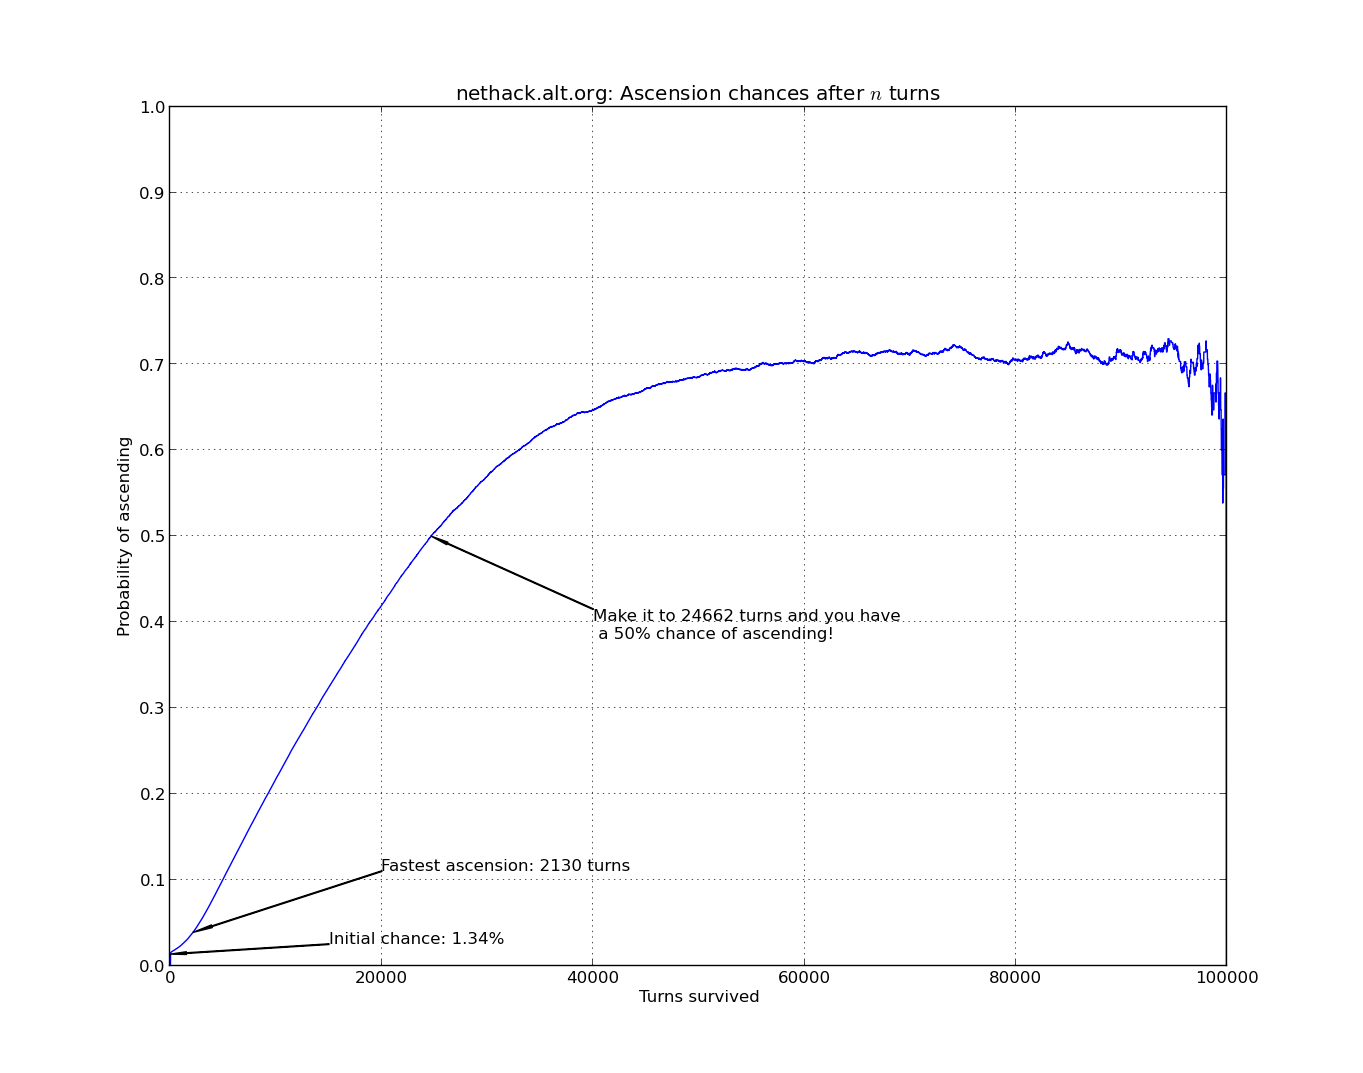
This graph shows your chance of ascending based on how long you survive in the dungeon, clearly demonstrating that the longer you survive, the better your chances. Notice though, that it never gets that certain: no matter how long you survive, it's possible to fall from glory (or, "Splat".) As the turns go on, fewer and fewer people have survived without already ascending, and the graph gets jagged and unreliable.
But what exactly is happening to our 2.3 million adventurers over the 100,000 turns graphed here? Time for more graphs:
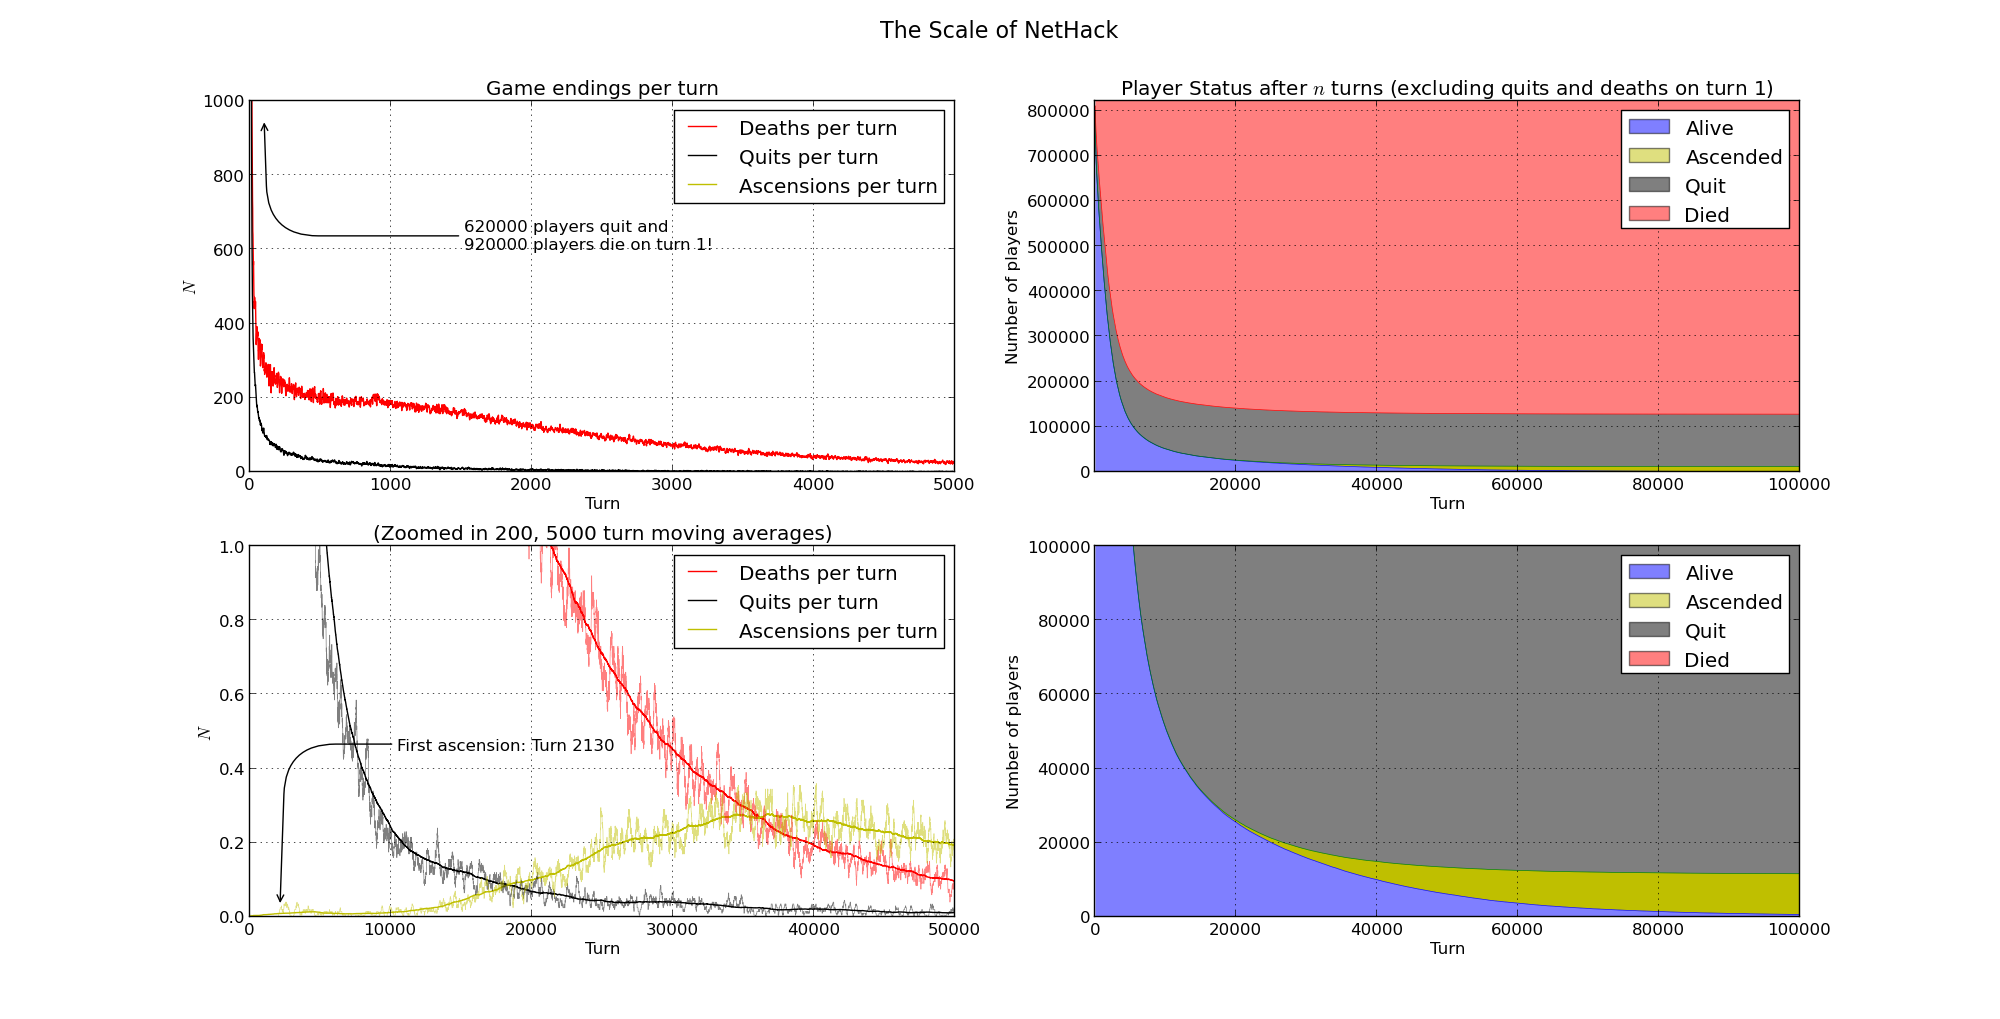
On the left, we see the number of players dying, quitting or ascending on each turn, on two different scales: Firstly at a large scale (but still not nearly including the vast numbers of people who quit or die immediately!) for the first 5,000 turns and then zoomed in up to 50,000 turns. Both graphs have been smoothed. Note that of the 920,000 "deaths" on the first turn, almost all are due to escaping the dungeon.
On the right, we look at how many players there are of each status (alive, ascended, dead, quit) after a number of turns. On the first graph you can see that the tiny quantity of ascensions barely even features, while in the zoomed-in graph you can see how the ascensions begin to accumulate. Since many many people quit on the first turn (either by #quitting or escaping) we have excluded them from these graphs.
Here's the code I used to gather statistics on the xlogfile:
import re
from numpy import *

def movingaverage(interval, window_size):
    window = ones(int(window_size))/float(window_size)
    return convolve(interval, window, 'same')

l = 100000
r = re.compile(':death=(?P<death>[^:]+).*:turns=(?P<turns>[0-9]+)')
total = 2361141 #Total number of records with extended data available

def parse():
    global dies, quits, asc, alive, alive_asc, alive_asc_quit
    dies = [0] * l
    quits = [0] * l
    asc = [0] * l

    for line in open('xlogfile.full.txt', 'r'):
        m = r.search(line)
        if m:
            turns = int(m.group('turns'))
            if turns >= l:
                continue
            if m.group('death') == 'quit':
                quits[turns] += 1
            elif m.group('death') != 'ascended':
                dies[turns] += 1
            else:
                asc[turns] += 1

cumtotal = total - dies[1] - quits[1]
alive_asc_quit = cumtotal - cumsum(dies[2:])
alive_asc = alive_asc_quit - cumsum(quits[2:])
alive = alive_asc - cumsum(asc[2:])
Now back to 'hacking!